Mid-Month April 2025: Ellie vs. Tariffs
By: Kyle McBurney, CFP

A wicked smart guy named Samuel Clemens once remarked: “It ain’t what you don’t know that gets you in trouble. It’s what you know for sure that just ain’t so.”
Clemens never legally changed his name, but he did use one of the most iconic pen names in literature: Mark Twain. The pen name is borrowed from riverboat lingo indicating safe water ahead, at least two fathoms deep (12 feet). Fathom is a great word, no?
It’s what you know for sure that just ain’t so.
Maybe Mr. Clemens was offering timeless advice to investors, reminding them that overconfidence in financial outcomes can wreak havoc on portfolios.
Or maybe he was talking to parents like us, who were absolutely, positively, without a shadow of a doubt, convinced that player #3 would be a boy.
On March 13th, at 7:06 p.m., Emily Caitlyn McBurney was born, surprising her parents in the best possible way. We will call her Ellie.
Fourteen hours later, markets opened with a bang. After one of the fastest corrections in recent memory, stocks bounced sharply. Friends and clients joked about the “Ellie Bounce,” fueled, of course, by diaper stimulus and pink onesies. But, just like that first week home with a third child, the calm didn’t last long.
On April 2, the Trump administration unveiled a sweeping new tariff policy, building on signals that had been gathering for months. Branded “Liberation Day,” it included a 20% blanket tariff on all imports, immediate higher “reciprocal” tariffs on goods from other countries that were based on interesting math, and a hefty 25% levy on imported autos. The announcement came in hot—well beyond what markets had priced in.
The reaction? Swift—and ugly. Tech stocks, deeply tied to global supply chains, fell fast. Apple, Amazon, Nvidia, and Tesla dropped 4–6% in after-hours trading. The broader market tumbled. Goldman Sachs and JP Morgan cut their GDP forecasts and raised recession odds. Worse yet, some analysts warned the tariffs could push inflation up another full percentage point, putting the Fed in even more of a bind.
Then came the plot twist.
With both stocks and bonds flashing warning signs and the threat of a recession looming, President Trump abruptly announced a 90-day pause on the most aggressive tariffs, citing ongoing negotiations and a scaled-back 10% reciprocal rate. The market’s reaction? Thrilled. The Nasdaq surged 12%—its best day in 24 years. The S&P 500 climbed 9.5%, and the Dow soared 3,000 points, its largest single-day gain in history.
It’s what you know for sure that just ain’t so.
This incredible rally reminds us how quickly sentiment can shift and the dangers of getting swept up in the moment. Markets don’t move on fundamentals alone. They react to headlines, tone, fear, hope, and expectations. For long-term investors, this is why we stay invested, stay diversified, stay disciplined, and avoid making big decisions based on short-term noise. It is easy to forget just how many drawdowns have occurred in recent years. Over the last ten years, we have averaged a 20% drawdown every two years. Sometimes quickly, sometimes slowly, but historically, all bear markets recover in time.
Our team has been very busy behind the scenes. We’ve been rebalancing across the board, harvesting losses, leaning into areas with more stability, and keeping portfolios aligned with your long-term goals.
Tariffs carry both economic and emotional weight. In our view, the response has been more emotional than economic. We’re still in the early days of understanding their full impact, but we’re confident that a steady, thoughtful approach gives us the best chance to navigate what’s ahead.
There’s much to unpack this month—so let’s dive in.
The New Tariff in Town
Well, we knew tariffs were coming—just maybe not this many, this fast, or this steep.
Trying to track tariff policy this week feels a bit like chasing my toddler around a crowded playground: erratic, unpredictable, and potentially hazardous to your sanity. In just the past week, we have seen:
- A removal back down to 10%
- 50% Chinese Tariffs
- 90% Chinese Tariffs
- 104% Chinese Tariffs
- 125% Chinese Tariffs
- 145% Chinese Tariffs
- Electronics exempted
- Electronics now back on
Clearly, these are moving targets, and it's best not to overreact until the dust settles.
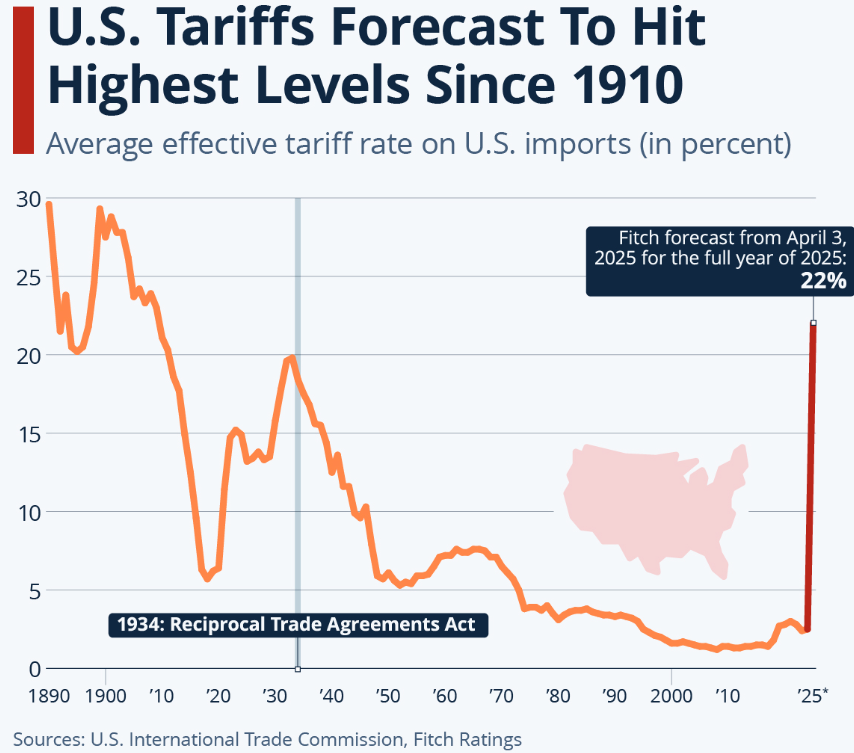
Today, Bloomberg and Fitch economists updated their average US tariff rate estimates. They now estimate it is 20.4% above last year's rate of 2.4%, or 22.8%. Their initial estimate after Liberation Day was 24% (China tariffs drive this number as they do not get the pause).
So, it has hardly changed and is still ten times higher than last year and the highest level in a century (even higher than the infamous Smoot-Hawley Tariffs).
Looking back, tariffs have a poor track record of success. It is similar to the batting average of reality tv relationships (basically 0%).
Let’s review, shall we?
1. Tariff of Abominations (1828)
This tariff earned its pleasant nickname from the South, which despised it. It triggered the Nullification Crisis—one of many sparks of the Civil War.
2. The Black Tariff (1842)
This amounted to a sharp reversal back toward protectionism. It was meant to help domestic industry but wound up hurting international trade instead.
3. Smoot-Hawley (1930)
It raised tariffs on 20,000+ imports, deepened the Great Depression, and induced global retaliation.
Or, in the words of Pete Campbell from Mad Men: “Not great, Bob!”
Milton Friedman put it even more sharply:
“We call a tariff a protective measure. It does protect; it protects the consumer very well against one thing. It protects the consumer against low prices.”
That’s why markets rallied when the Trump administration unexpectedly tapped the brakes. The 90-day pause was a welcome sign that cooler heads might prevail—and that the administration may be more flexible than feared.
The silver lining? Policymakers can roll back or negotiate these tariffs very quickly. Whether this is a negotiating tactic or the start of a broader policy shift is in flux. Either way, trade policy holds real sway and will likely shape market behavior in the weeks, months, and years ahead.
As the landscape shifts, we’re seeing nimble companies reassessing their supply chains, and we’re doing the same in portfolios. We are rebalancing where needed, harvesting losses, and staying laser-focused on stability and downside protection.
We saw a rally last week, but signs of strain remain, and we’re staying proactive as risk managers.
Cracks in the Foundation?
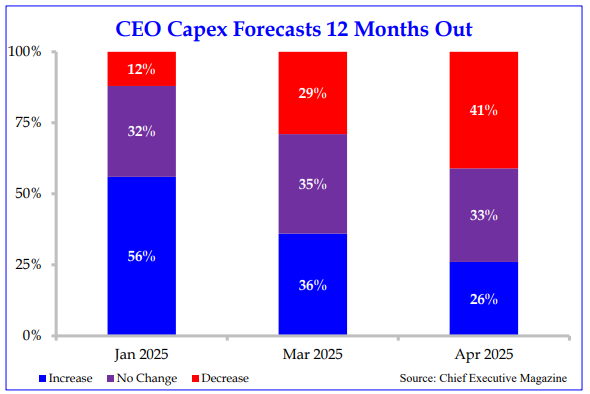
Back on November 6th, if you asked a room full of CEOs what 2025 might look like, you’d have gotten a round of confident nods. Tax cuts were on the table. Capital spending was revving up. Industrial construction and manufacturing had just hit record highs. Business confidence was rising, and the vibe was damn the torpedoes, full steam ahead.
That was then.
Now? The tone has shifted. Policy uncertainty is in the air, and business leaders are starting to pump the brakes. Fast-moving survey data shows capital expenditure plans flatlining or decreasing. Headline data remains strong, but early warning lights are blinking. And when business investment hesitates, a growth slowdown tends to follow.
Why does it matter? Business spending is fuel for the economy, and lately, the tank has looked a little low.
The manufacturing sector is already feeling the pressure. Machinery companies report rapid deterioration. Oil and gas firms are warning of a cyclical trough. Manufacturers in tech and chemicals are warning that rising costs and tariff uncertainty are dimming their forecasts.
One ISM respondent was quite direct:
“Trump, tariffs, massive uncertainty—how can you do business planning with all of this uncertainty and the daily changes in direction?”
It’s not a crisis yet. But cracks are forming. Fewer firms are investing in equipment. CEO and CFO confidence—metrics we watch closely—may dip further in the months ahead. Capex hasn’t collapsed, but the ceiling feels lower. And that shifts the risk to the downside. It is another reason we like to have a bit of extra defense on the field.
And it’s not just corporate leaders feeling anxious.
In April, consumer sentiment declined significantly. The University of Michigan’s preliminary reading dropped to 50.8, marking the second-lowest level since the survey began in 1952. That’s a 10.9% decrease from March and 34% below April 2024 levels.

University of Michigan, Survey Research Center, Surveys of Consumers
What’s driving the anxiety? Inflation expectations are back in the spotlight.
Consumers now expect inflation to hit 6.7% over the next year—the highest outlook since 1981. Long-term expectations climbed to 4.4%, a level last seen in the early ’90s. Confidence fell across all ages, incomes, and political affiliations. And unemployment fears are the highest they’ve been since 2009.
A notable drop in consumer sentiment matters because when it drops this hard, people tend to pull back by spending less, investing less, and holding on to more cash.
The uncertainty adds another layer to the recession risk story. It slows down both Wall Street and Main Street. And even if market indicators aren’t flashing red yet, the Fed pays close attention when consumers start looking over their shoulders. Expectations, after all, can become reality if enough people start acting on them.
What About Some Good News?
After all, that’s what makes a market—buyers and sellers with different views of what’s ahead.
Despite the headlines, hand-wringing, and noise, the S&P 500 is hanging tough. As I write this, it’s down about 8.3% on the year (per Koyfin). That’s no picnic, but it’s hardly a disaster.
And just like we manage risk on the downside, we need to stay open to what could go right. Because sometimes, the story changes fast—faster than a tweet.
Literally.
Here are a few reasons we’re not giving up on stocks:
1. Tariff Relief Is Already Happening
Recent policy moves quietly rolled back around $80 billion in tariffs (mostly on Chinese goods). That’s real relief for businesses and could help ease inflation pressures. A nice win for Apple (at least for now).
2. Dollar Weakness May Not Last
The recent dip in the U.S. dollar is mainly tied to short-term liquidity flows (think tax season cash movements). As that reverses, the dollar could strengthen—supporting U.S. assets.
3. Some Believe the Fed May Act
Bond market volatility has a way of getting the Fed’s attention. If current trends persist, we could see rate cuts come quicker and more forcefully than markets expect.
4. The U.S. Still Has a Lot Going for It
Reserve currency status. Global demand for our companies and capital markets. Yes, volatility is real, but the long-term fundamentals remain solid.
5. Tax Cuts on the Table
Strategas points to possible tax cuts as early as May to provide some relief from tariff-related joint pain.
And it’s not just a U.S. story. International stocks are quietly doing their thing. As of this writing, developed markets have risen by 6.5% for the year, and emerging markets have eked out a 0.7% gain (again, per Koyfin).
Chart of the Month: Bond market volatility is the likely reason for the tariff pauses.
Bill Clinton’s chief strategist, James Carville, famously said: “I used to think that if there was reincarnation, I wanted to come back as the President or the Pope or as a .400 baseball hitter. But now, I would want to come back as the bond market. You can intimidate everybody.”
I suppose everyone really does have a boss.

Reminder of the Month – Never try to predict the future. You can look foolish. Remember that Mark Twain quote from earlier? Consider the following.
Allocation Update
With so much uncertainty, we’ve made a few adjustments behind the scenes.
Our current preference is to have more defense on the field than offense. That means raising cash levels in portfolios—not as a market-timing move, but to add stability and flexibility. Cash allows us to be patient and opportunistic, especially in an environment where headlines and policy shifts can move markets in minutes.
We remain focused on quality and balance, but in recent weeks, we’ve dialed down some of our more aggressive equity exposure in favor of defensive sectors and income-generating positions. We continue to lean toward value stocks and dividend payers, and we’ve maintained our international exposure, particularly in developed markets like Europe, where valuations remain attractive.
And yes, we still like gold. We like it even more now. Gold continues to hedge against inflation, geopolitical tension, and policy uncertainty. But it also plays a role in guarding against the broader trends we’re seeing—de-dollarization, deglobalization, and rising global stimulus.
Our IPS-focused approach hasn’t changed, but the current environment has reinforced our belief in staying flexible, focused, and disciplined. Markets are unpredictable, but a strong, well-constructed portfolio can weather the swings—and be ready to take advantage of the opportunities they create.
Here's a snapshot of our perspectives:
Equities – Underweight:
International Balance: While still light in emerging markets, we added to developed international earlier in the year and have maintained that balance.
Developed International: The trend continues, as developed equities are outpacing the S&P 500 by 15% (Koyfin), while showing strength through recent volatility.
Fixed Income – Neutral:
Core Bonds: We remain balanced and are taking a “wait and see approach” regarding tilting towards short or longer dated bonds. Rising rates are not encouraging.
Floating-rate Bonds and CLOs: Yields remain strong and are a nice hedge against the possibility of higher rates.
Alternatives – Overweight
Gold Overweight: Gold continues to perform well and serves as a nice hedge against inflation/dollar risk.
Growing Interest in Private Alternatives: Where applicable, our team expects to utilize private investments more meaningfully moving forward.
Cash – Overweight
Strategic Use of Cash: Cash continues to offer valuable stability and flexibility in uncertain markets while still delivering yields above 4%.
Life with three kids has been hectic, exhausting, and amazing. Heather, as always, has been a rockstar—she deserves all the credit. Getting to three kids has always been the dream, and reaching our goal feels incredible.
As the proud papa, my role is handling the two older boys. Some might call this "zone defense," but as an experienced basketball player, I'd say it's more of a "help side man" strategy. I focus on our two-year-old while keeping our six-year-old within arm's reach.
Wish us luck—we (mostly me) will need it! I am already two fathoms deep in diapers.
Thanks, as always, for your continued trust and readership. Oh, and happy Tax Day to all!
Kyle M. McBurney, CFP®
Managing Partner
CRN202804-8569874
The opinions expressed herein are those of Kyle McBurney, CFP as of the date of writing and are subject to change. This commentary is brought to you courtesy of Highland Peak Wealth which offers securities and investment advisory services through registered representatives of MML Investors Services, LLC (Member FINRA, Member SIPC). Supervisory office: 280 Congress Street, Boston, MA 02210. (617)-439-4389. Highland Peak Wealth is not a subsidiary or affiliate of MML Investors Services, LLC or its affiliated companies. Past performance is not indicative of future performance. Information presented herein is meant for informational purposes only and should not be construed as specific tax, legal, or investment advice. Although the information has been gathered from sources believed to be reliable, it is not guaranteed. Please note that individual situations can vary, therefore, the information should only be relied upon when coordinated with individual professional advice. This material may contain forward looking statements that are subject to certain risks and uncertainties. Actual results, performance, or achievements may differ materially from those expressed or implied. This material does not constitute a recommendation to engage in or refrain from a particular course of action. Referenced indexes, such as the S&P 500, are unmanaged and their performance reflects the reinvestment of dividends and interest. Individuals cannot invest directly in an index.
Glossary of Index Definitions
Indexes are unmanaged, do not incur fees or expenses, do not reflect any deduction for taxes, and cannot be purchased
directly by investors.
The S&P 500® Index is a widely recognized, unmanaged index representative of common stocks of larger capitalized U.S. companies.
The S&P Muni Bond Index is a broad, market value-weighted index that seeks to measure the performance of the U.S. Municipal bond market.
Dow Jones Industrial Average is a price-weighted average of 30 actively traded Blue Chip stocks, primarily industrials, but also including other service-oriented firms; may be used as a benchmark for large cap stocks
NASDAQ Composite is a broad-based index of over 3,000 companies, which measures all domestic, and non-U.S.-based common stocks listed on the NASDAQ Stock Market, Inc.
The NASDAQ 100 U.S. Index is a composed of the 100 largest, most actively traded U.S. companies listed on the Nasdaq stock exchange.
The Russell 2000® Index is a widely recognized, unmanaged index representative of common stocks of smaller capitalized U.S. companies.
The MSCI EAFE Index is a widely recognized, unmanaged index representative of equity securities in developed markets, excluding the U.S. and Canada.
The MSCI Emerging Markets (EM) Index is an unmanaged market capitalization-weighted index of equity securities of
companies domiciled in various countries. The Index is designed to represent the performance of emerging stock markets
throughout the world and excludes certain market segments unavailable to U.S.-based investors.
The MCSI All Country World Index (ACWI) captures large and mid cap representation across 23 Developed Markets and 24 Emerging Markets.
The Barclays U.S. Aggregate Bond Index is a broad measure of the U.S. investment-grade fixed-income securities market.
The Bloomberg U.S. Aggregate Bond Index is an unmanaged index of fixed-rate investment-grade securities with at least one year to maturity, combining the Bloomberg U.S. Treasury Bond Index, the Bloomberg U.S. Government-Related Bond Index, the Bloomberg U.S. Corporate Bond Index, and the Bloomberg U.S. Securitized Bond Index.
The Nikkei Index is a price-weighted index composed of Japan’s top 225 blue-chip companies traded on the Tokyo Stock Exchange.
©2023 Morningstar, Inc. All Rights Reserved. The information contained herein: (1) is proprietary to Morningstar and/or its
content providers; (2) may not be copied or distributed; and (3) is not warranted to be accurate, complete or timely. Neither Morningstar nor its content providers are responsible for any damages or losses arising from any use of this information