

March 2025 - Market Madness
By: Kyle McBurney, CFP
Managing Partner at Highland Peak Wealth

March Mayhem is here! And oh yes, there’s also a basketball tournament happening this month.
This newsletter will be shorter than usual. My trademark verb-ocity will be back next month. With “Baby Watch” in full swing, time is of the essence.
We will spare you a deep dive into tariffs and their potential impact. We have seen the studies from Yale, Bloomberg, and the Tax Foundation (to name a few), and while they are impressive, the impact is all guesswork at best. Not to mention, the off-and-on-again approach reminds me of when my two-year-old discovered light switches. I do not doubt that the story will have changed by the time this newsletter is published. (Editor’s note: It did.)
If it feels like the market is throwing a lot at us right now, it’s because it is. Consumer confidence just fell off a cliff in February, and the Fed’s World Uncertainty Index (yes, that’s a real thing) hit a historic high—higher than during COVID—and the dreaded “r” word (recession) is creeping back into the conversation as growth expectations start to soften.
But is it time to hit the panic button? Not necessarily.
Before doing anything rash, let’s all keep in mind:
We’ve seen this rodeo before. The 2018-2019 trade war saw similar reactions, only for markets to recover and reach new highs.
While consumer sentiment is down, it is still far from crisis levels. A single monthly dip does not define an economic trend.
Bull markets don’t just roll over and die. The current bull run is three years old, and while volatility is natural, history suggests it takes more than trade posturing to derail long-term growth.
However, adjustments should be made. We are still focused on the long game and continue to see some interesting themes develop in the market.
First, international stocks are finally waking up. The Euro Stoxx 50 is off to a strong start, outpacing the S&P 500 by a wide margin, while valuations abroad still look attractive. European spending is rising in contrast to U.S. austerity. Is International Great Again?
Second, value stocks are leading the way. Growth and tech stocks had their moment, but value takes over when markets shift from hype to fundamentals. This trend is off to a strong start.
As is our style, these adjustments don’t represent a wholesale shift in strategy—just tweaks to capitalize on emerging trends.
Through it all, a globally diversified portfolio is still positive for the year. U.S. stocks are down, but international equities are finally providing the boost markets have been waiting for. Will it continue? Maybe. As we move through March, we will be very focused to see if this trend continues to strengthen.
We still believe the long-term story is intact. After such an outstanding ’23 and ’24 for markets, markets expected some degree of increased volatility. Ryan Detrick recently noted, “Unless we’re in a bear market, extreme sentiment levels like we’re seeing today tend to indicate a bottom is near.” In other words, stay the course and look for opportunities.
As always, we’re here to answer questions and guide you through the noise.

Quick Hits
Here is what’s on our mind –
1) Treasury Yields
The Bond Market gets the joke first.
This old saying exists for a reason. Bond investors tend to focus more on fundamentals than stock traders and usually see the warning signs first. When something's brewing under the surface, the bond market reacts before the equity market catches on.
So, what are we seeing? Yields are dropping. Per Koyfin:
📉 10-Year Treasury Yield (January 14): 4.79%
📉 10-Year Treasury Yield (March 6): 4.29%
That’s a 10% drop in less than a month—enough to turn some heads.
Our take? While DOGE and the Trump Administration may be gaining some ground in the fight against inflation (good), economic growth may be the sacrificial lamb (not good). Historically, bonds have provided a buffer against stock volatility when rates fall, and that relationship appears to be intact for now.
2) Atlanta Fed & Global Growth
The Atlanta Fed’s GDPNow model is attracting headlines, but let’s be clear—it’s an estimate.

Based only on recently released data, GDPNow is a real-time, automated estimate of economic growth—useful, but far from perfect. With rates falling, it’s an interesting indicator to watch. Admittedly, GDP accounting can sometimes be funky, but is this a temporary dip or a deeper concern?
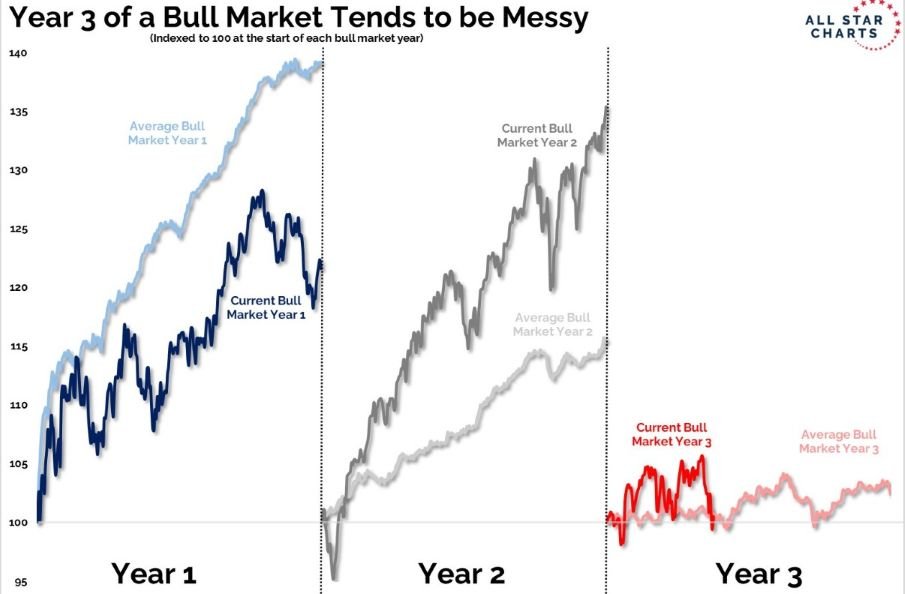
3) Historically Normal Start to Year 3
Year three of a bull market tends to be choppy. More volatility, more pullbacks, more questions. But historically? The ending is usually positive. It’s like The Godfather Part III—not as smooth as the first two, but still (mostly) worth sticking around for. Bad example?
4) International More Room to Run?
U.S. stock market dominance may finally be fading. International markets have started the year strong, narrowing the performance gap with the U.S. We’re watching to see if this trend continues. We’re watching closely—if global stocks are waking up, this could be just the beginning.

Source: Strategas
Allocation Update
Yes, tariffs could shake things up—no doubt about it. But let’s not pretend we know exactly where this all lands.
Yes, volatility has picked up—but that’s the price of admission. It’s what you sign up for in markets.
And yes, treasury markets and growth expectations are flashing some warning signs—but not everything is sounding the alarm. Other indicators remain steady.
None of this has changed our approach. Recent swings have only reinforced our focus on quality and balance. With valuations stretched and growth shifting, developed international markets—especially Europe—stand out.
We’re also leaning into value and defensive stocks over high-growth and tech. The market has been rewarding companies with strong fundamentals, steady cash flows, and lower volatility—and we see this as an essential part of portfolio construction right now.
Meanwhile, bonds are proving their worth again. With yields falling, bonds have outperformed the S&P 500 this year, offering a much-needed hedge against stock market swings. And alternatives—private credit, private equity, and hedge strategies—continue to provide diversification outside of traditional stocks and bonds.
And yes, we still like gold. It’s been a strong performer over the last two years and remains a reliable hedge against inflation, geopolitical risk, and fiscal uncertainty.
Through it all, our focus remains the same: quality, risk management, and diversification. Markets will do what they do. Staying disciplined and adaptable keeps portfolios well-positioned—volatility and all.
Here's a snapshot of our perspectives:
Equities – Modest Overweight Remains for Now:
U.S. Stocks Still Preferred: Our inclination towards U.S. equities over international markets is still in place (for now). But the strong start in international stocks has our attention.
Mid-Cap Tilt: Earnings growth, cheaper valuation, and AI exposure are noteworthy.
Developed International: Per Koyfin, developed international stocks are up +10% to start the year, outpacing U.S. markets by +13%. European stocks, in particular, have gained momentum. Will it last?
Fixed Income – Slight Underweight:
Core Bonds: We remain balanced and are taking a “wait and see approach” regarding tilting towards short or longer dated bonds. Fed and fiscal policy will provide clues.
Floating-rate Bonds and CLOs: Yields remain strong and are a nice hedge against the possibility of higher rates.
Alternatives – Neutral
Gold Overweight: Gold continues to perform fantastically well and serve as a nice hedge against inflation risk.
Growing Interest in Private Alternatives: Where applicable, our team expects to utilize private investments more meaningfully moving forward.
Cash – Neutral
Strategic Use of Cash: Yields have become less attractive as rates fall.
No big update here! Once again, excuse the brevity—Player #3 is almost here, and fatherhood is calling (literally, any minute now). It’s shaping up to be an exciting week ahead.
I hope to share news with you all soon enough. Now, if you’ll excuse me, I can feel my wife rolling her eyes at me from the other room.
Thank you, as always, for your readership and trust.
Kyle M. McBurney, CFP®
Managing Partner
CRN202803-8287455

The opinions expressed herein are those of Kyle McBurney, CFP as of the date of writing and are subject to change. This commentary is brought to you courtesy of Highland Peak Wealth which offers securities and investment advisory services through registered representatives of MML Investors Services, LLC (Member FINRA, Member SIPC). Supervisory office: 280 Congress Street, Boston, MA 02210. (617)-439-4389. Highland Peak Wealth is not a subsidiary or affiliate of MML Investors Services, LLC or its affiliated companies. Past performance is not indicative of future performance. Information presented herein is meant for informational purposes only and should not be construed as specific tax, legal, or investment advice. Although the information has been gathered from sources believed to be reliable, it is not guaranteed. Please note that individual situations can vary, therefore, the information should only be relied upon when coordinated with individual professional advice. This material may contain forward looking statements that are subject to certain risks and uncertainties. Actual results, performance, or achievements may differ materially from those expressed or implied. This material does not constitute a recommendation to engage in or refrain from a particular course of action. Referenced indexes, such as the S&P 500, are unmanaged and their performance reflects the reinvestment of dividends and interest. Individuals cannot invest directly in an index.
Glossary of Index Definitions
Indexes are unmanaged, do not incur fees or expenses, do not reflect any deduction for taxes, and cannot be purchased
directly by investors.
The S&P 500® Index is a widely recognized, unmanaged index representative of common stocks of larger capitalized U.S. companies.
The S&P Muni Bond Index is a broad, market value-weighted index that seeks to measure the performance of the U.S. Municipal bond market.
Dow Jones Industrial Average is a price-weighted average of 30 actively traded Blue Chip stocks, primarily industrials, but also including other service-oriented firms; may be used as a benchmark for large cap stocks
NASDAQ Composite is a broad-based index of over 3,000 companies, which measures all domestic, and non-U.S.-based common stocks listed on the NASDAQ Stock Market, Inc.
The NASDAQ 100 U.S. Index is a composed of the 100 largest, most actively traded U.S. companies listed on the Nasdaq stock exchange.
The Russell 2000® Index is a widely recognized, unmanaged index representative of common stocks of smaller capitalized U.S. companies.
The MSCI EAFE Index is a widely recognized, unmanaged index representative of equity securities in developed markets, excluding the U.S. and Canada.
The MSCI Emerging Markets (EM) Index is an unmanaged market capitalization-weighted index of equity securities of
companies domiciled in various countries. The Index is designed to represent the performance of emerging stock markets
throughout the world and excludes certain market segments unavailable to U.S.-based investors.
The MCSI All Country World Index (ACWI) captures large and mid cap representation across 23 Developed Markets and 24 Emerging Markets.
The Barclays U.S. Aggregate Bond Index is a broad measure of the U.S. investment-grade fixed-income securities market.
The Bloomberg U.S. Aggregate Bond Index is an unmanaged index of fixed-rate investment-grade securities with at least one year to maturity, combining the Bloomberg U.S. Treasury Bond Index, the Bloomberg U.S. Government-Related Bond Index, the Bloomberg U.S. Corporate Bond Index, and the Bloomberg U.S. Securitized Bond Index.
The Nikkei Index is a price-weighted index composed of Japan’s top 225 blue-chip companies traded on the Tokyo Stock Exchange.
©2023 Morningstar, Inc. All Rights Reserved. The information contained herein: (1) is proprietary to Morningstar and/or its
content providers; (2) may not be copied or distributed; and (3) is not warranted to be accurate, complete or timely. Neither Morningstar nor its content providers are responsible for any damages or losses arising from any use of this information