September 2025 - Market Odyssey
By: Kyle McBurney
Managing Partner at Highland Peak Wealth, CFP

"Human-light." I couldn't shake that phrase as I read the Wall Street Journal on a very crowded, decidedly not human-light train into Boston.
The phrase comes from the global logistics company C.H. Robinson Worldwide’s CFO Damon Lee, who used it to describe how AI is reshaping work: "The processes are human-light now." I take it as a polite way of saying” we’ve unleashed the robots.” And who can blame Mr. Lee? Despite an 8% drop in revenue, the company posted higher profit margins in Q2, thanks to a 35% productivity boost since 2022 (hello, AI).
On Wall Street, profits are strong, productivity is rising, and investors hail AI as a long-term growth driver.
On Main Street, the story looks very different. Job security feels shaky, postings are slowing, and in August, the U.S. economy added just 22,000 jobs—far below the 75,000 economists expected. Even more striking, for the first time in four years, unemployed Americans now outnumber available job openings.
The paradox is striking.
Last week's shaky jobs report reminded me of my early days in '08/'09 when every nail-biting report got picked apart. Some blame tariffs or other government policies, but CEOs and CFOs are humming a different tune.
Companies aren’t just experimenting with AI anymore; they are rebuilding entire workflows around it. A Korn Ferry survey of 15,000 professionals found that +40% of companies have cut layers of management this year.
The labor market feels different these days, uncharted. Maybe it's because AI has quietly gone full HAL 9000, calmly telling us, "I'm sorry, Dave. I'm afraid I can't do that," while productivity climbs and job postings shrink.
Yet the bigger economic picture still offers reasons for optimism. Policy leans toward stimulus, with possible Fed easing and regulatory relief as the economy is expected to remain in growth mode. Small-cap stocks have begun to outperform, and industries that have lagged (homebuilders, trucking, construction, and transportation) are showing signs of life. Key indicators remain resilient: financial conditions are easy, credit spreads are low, and corporate profits—oh so important for markets—are holding.
Simply put, productivity gains, policy support, and selective cyclical opportunities suggest the market rally can still push higher, even as the labor market adjusts. After all, never count the U.S. worker out. Whether it's steam engines, combines, mainframe computers, or generative A.I., the American workforce has always found a way.
Looking ahead, we see a mix of caution and opportunity. Mr. Market remains as mercurial as ever, perhaps a tad more wobbly than usual with tariffs looming and employment cracks widening. But don't lose sight of the positives: AI-driven productivity, policy tailwinds, and solid corporate fundamentals still have the power to boost markets higher.
We have balanced our client portfolios to reflect this environment. They are well-positioned to capture the upside from productivity gains, small-cap breakouts, and supportive policy, while remaining mindful of labor market shifts and uncertainties ahead. It's a moment that rewards diversification, flexibility, and recognition of trends shaping the market and the economy. In other words, it's not a human-light approach. Just like Dr. Bowman in 2001: A Space Odyssey, we're still in control of the mission (for now).

Summer Fades, Markets Remain Warm
August kept the rebound alive, despite tariffs and the rest. Markets climbed, tariff chatter faded, and new leaders stepped forward. Global stocks added 2.5%, bonds gained 1.2%, and the bounce from spring lows kept building. Year-to-date, global equities are now up more than 14%. Easy. Right?
Tariffs still made headlines—the U.S. raised rates on several partners and later targeted India over Russian oil—but the drama has cooled. What once rattled markets now feels like background noise, with investors more focused on growth than politics (for now).
Leadership shifted in interesting ways. The S&P 500 rose 2.0%, but developed international markets stole the spotlight with a 4.3% jump, while emerging markets lagged at +1.3%. Strength remains broad, even if leadership keeps rotating.
Earnings also gave equities a lift. By late August, 96% of S&P 500 companies had reported, with nearly 80% beating expectations, the best rate since 2021. Earnings grew 11.5% year over year, powered by all the usual tech standouts and financials (+20%). Corporate profits drive markets, and so far, so good.
Small caps were the real surprise. The Russell 2000 surged more than 7% in August, fueled by easing inflation, steady growth, and rising odds of Fed cuts. That’s not the move you see in weak markets. As Jerry Seinfeld might say: “I’m not wrong, am I?”
Jobs data, however, showed cracks, pointing to a cooling labor market. That set the stage for Jerome Powell’s Jackson Hole comments, where he stressed that the Fed remains data-driven, not politically driven. Markets took note. A 0.25% September cut is now the base case, though some, like Standard Chartered, are calling for 0.50% given the labor softness.
In the near term, the Fed will set the tone. All eyes are on the September 16–17 FOMC meeting. If cuts arrive as expected, the biggest beneficiaries may be the market’s understudies—small caps and value stocks that tend to shine when borrowing costs fall and market participation broadens.
Is Boring Back?
In our view, this is a massive question for portfolio positioning moving forward.
What do we mean by boring? These are the companies outside of tech with less flashy businesses, steadier earnings, and lower valuations. Think of banks, utilities, and industrials, the workhorses that keep the economy humming even as the tech darlings hog the headlines.
Tech has dominated market returns of late, and that shouldn't surprise anyone. The Magnificent 7 have fueled much of the market's rise since the 2022 lows. According to Apollo, the top 10 stocks in the S&P 500 have contributed 54% of the market's gains since January 2021, a level of dominance rarely seen in market history.
Everything else—the so-called boring stocks—has been, frankly, just meh.
But we may finally be seeing the transition we've been waiting for. In August, banks rallied, small caps led, and value stocks outperformed growth. One month doesn't make a trend, but with all these pieces moving in tandem, it has our attention.
We see two key forces that could continue pushing small caps and "boring" companies higher:
1) Expensive Valuations in Tech
Tech stocks are expensive, no matter how you slice it. For years, those valuations seemed justified as earnings growth continued to skyrocket.

Source: FactSet, Standard & Poor’s, J.P. Morgan AM
But the chart from J.P. Morgan tells a revealing story: while the rest of the market is slowly catching up in earnings growth, the Magnificent Seven's year-over-year growth is coming down.
It's not that these companies are making less money—the challenge is maintaining such incredible growth rates.
To use my own phrase: how much better can better-er get?
I'll trademark that one later.
Today’s mega cap companies perfectly illustrate this dilemma. For example, a well known chip company once again crushed earnings expectations in Q2, with impressive revenue and EPS growth. The numbers were undeniably strong—yet the stock slipped afterward. Why? When you're already priced for perfection, even stellar results can feel "just okay" to the market.
What happened in this example isn't a knock on the company; it's a reflection of stretched valuations. It reminds me of Apple in 2011 and 2012. When the bar is set impossibly high, it becomes harder for any company, no matter how dominant, to satisfy the market's appetite for outsized beats.
This dynamic is why we wouldn't be surprised to see value stocks continue leading. Investors are discovering growth and opportunity in more boring sectors. Look at banks: according to Bloomberg, the bank sector (KBE) gained 8.61% in August, with regional banks (KRE) up 9.07%. Of course, there's more play here than just valuations.
2) Rate Cuts on Horizon
Following August’s weak labor report, markets are pricing in a 25 basis point cut when the Fed meets on September 17, with odds sitting around 88% as of Monday afternoon, according to CME Group data.
This shift is significant because falling rates have historically provided a meaningful boost to specific market segments. Value stocks and smaller companies, which are more sensitive to borrowing costs, tend to benefit most. Lower rates reduce the cost of capital, support earnings, and make it easier for these companies to invest in growth.
For small caps especially, which thrive when economic conditions encourage broader market participation, Fed easing could provide the tailwind they've been waiting for. Value stocks, too, often outperform when risk-free rates decline and investors start hunting for bargains beyond the mega-cap darlings.
The market has been ahead of this story.
The chart below shows the Russell 2000's impressive rally since hitting lows in April – a preview of what could come if rate cuts materialize as expected.
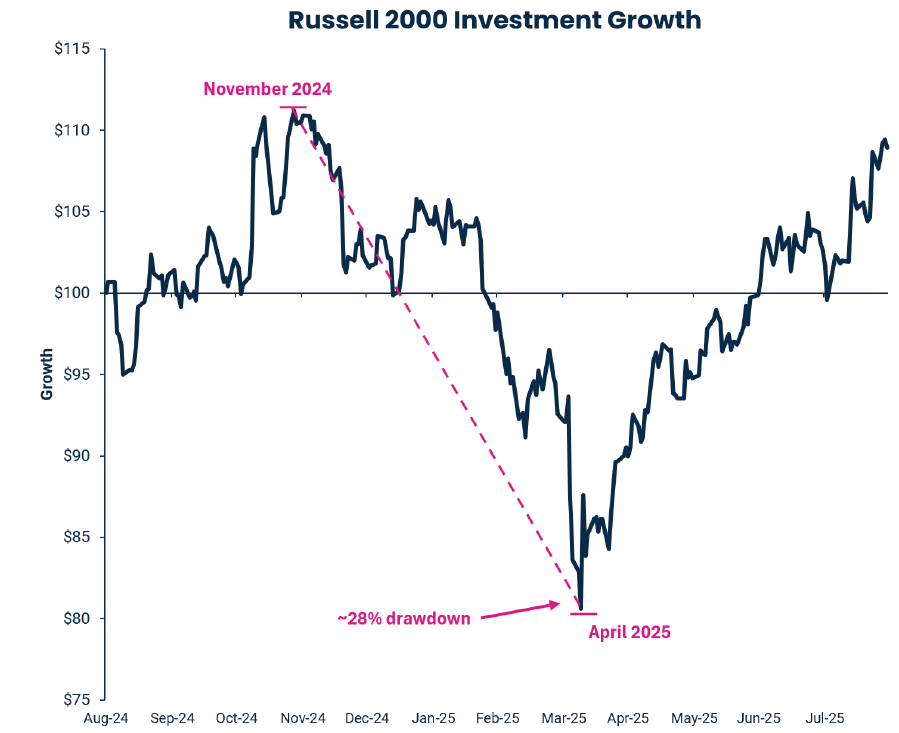
Source: Data as of 8/31/2025. Bloomberg.
As portfolio managers, we are happy to see small-cap and value stocks contributing to market returns in a meaningful way. It's an indication of a broader, healthier market.
Macro Thoughts
We recognize that there are plenty of nervous investors out there. We wouldn’t be surprised if recession talk picks up again in the coming weeks after the weaker-than-expected jobs report.
So far, we aren’t hearing much concern from CEOs and CFOs. Mentions of “recession” in company transcripts through the end of August remain near their lowest levels, reflecting a surprisingly resilient sentiment.
Looking at the bigger picture, the three key indicators we’ve been tracking this year continue to signal strength.
1) Financial conditions remain easy, with both high-yield and investment-grade credit spreads near cycle lows.
2) Initial jobless claims are still below 260K, though they’ve edged up slightly over the past six months to around 230K (DOL.gov).
3) Corporate profits remain solid as well, with S&P 500 next-twelve-month EPS growth at roughly 9%, up from 7.5% (per Strategas).
One of the most reliable early-warning indicators over the past 30 years has been residential construction employment. Historically, meaningful declines in this sector has preceded recessions. So far, we’ve only seen a modest dip. How this trend develops could be critical—not just for recession risk, but for whether the market rally has room to run.
With potential rate cuts on the horizon, this segment of the economy may get a boost, supporting continued market momentum. That’s one reason we remain constructive.
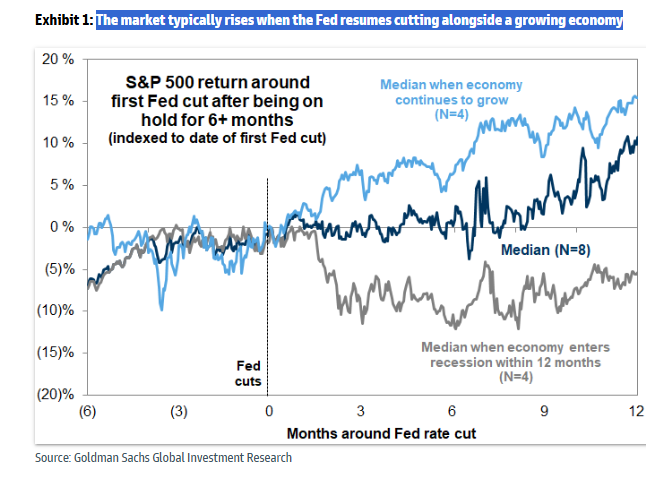
Chart of the Month: Sometimes market history tells a simple story. Rate cuts while the economy is growing are positive for stocks, but when the economy slows, watch out.
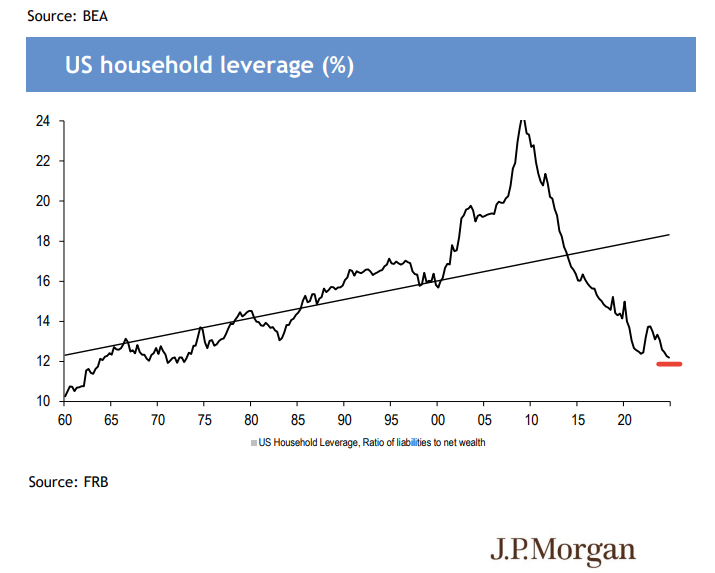
Different than ‘08: In our “peripheral vision” is real estate. Reading the data, there are some cracks, especially in states like FL and TX. But for those who want to compare it to ’08, we see a VERY different picture. Household leverage continues to go down, which historically reduces the risk of real estate collapse.
September Allocation Update
August gave investors plenty to cheer about, but history reminds us that September often has a reputation for being… a little ugly.
This trend is especially true in the first year of the presidential cycle. According to Bank of America Global Research, the S&P 500 has fallen 58% of the time in September, with an average decline of 1.62%. By contrast, the long-term monthly average for the index is about 0.6–0.7%.
Why bring this up? Think of it as a gentle nudge to stay alert. Some blame post-Labor Day trading, tax deadlines, or a busy economic calendar—but whatever the reason, September has a track record for bumpiness. Hang in there, though: November and December have historically rewarded investors.
That said, we’re not taking anything for granted. We remain constructive that equities can ride the summer momentum, but we’ve layered in some cushion to stay opportunistic.
At a micro level, we continue to focus on select growth areas, such as Artificial Intelligence and Energy Transition, while expanding our exposure to private markets and achieving global diversification. After August trading, small-cap and value stocks are catching our eye as exciting opportunities. We feel well-positioned, though we’ll have an even clearer view after the upcoming Fed meeting.
International markets also remain compelling. The dollar’s continued slide (slight drop in August) has been a gift for international investors, especially in emerging markets where commodity demand is strong. When the dollar weakens, global equities often benefit—and the data continues to reflect that dynamic.
Fixed income had its moment in August as well. Falling interest rates, fueled by dovish commentary from Jackson Hole, provided a modest tailwind for core bonds. While we remain underweight in fixed income relative to equities, we were happy with the gains.
We’re also keeping our precious metals and commodities positions, particularly gold, as a hedge against potential volatility. And we’re noticing continued institutional interest in crypto—a space we’re watching closely.
Bottom line: we’re optimistic but keeping both eyes on the road. Conditions look favorable for now, even with some labor market softness, but we know how quickly things can shift. Our approach remains flexible, ready to adjust as the facts evolve.
Here’s where we stand:
Equities – Balanced:
International Balance: Well balanced, as global stocks continue to deliver. Valuations remain attractive and the weaker dollar continues to provide momentum.
Small Caps: Could a possible September’s rate cut just what the doctor ordered?
Fixed Income – Underweight:
Core Bonds: With rate cuts on the horizon, looking at locking in yields where appropriate. Will add if economic data shows slowing growth.
Floating-rate Bonds and CLOs: Despite declining yields, these floating rate vehicles still provide above average income and hedge in case of inflationary shock.
Alternatives – Overweight
Gold Overweight: Gold continues to perform well and serves as a nice hedge against inflation/dollar risk.
Growing Interest in Private Alternatives: We continue to explore private investments where appropriate, based on client needs and market access.
Cash – Slight Overweight
Strategic Use of Cash: Cash continues to offer valuable stability and flexibility while still delivering yields above 4% (as of 9.8.25)
Growing up, I remember a humorous Staples back-to-school commercial that played to the Christmas tune of The Most Wonderful Time of the Year. A dad practically dances through the aisles, grabbing school supplies while his kids trudge behind him in despair. After a busy summer, I get it—I've officially become that dad.
Teddy is off to a fantastic start in first grade, picking up right where he left off. Cooper, our resident comedian, has started preschool and is already keeping his teachers on their toes. They keep saying how different he is from Teddy… maybe I should confirm the paperwork just to be sure. And Ellie, somehow almost six months old, continues to be pure joy. She's racking up MVP honors in the family and even starting to sleep through the night (knock on all the wood).
Wishing you a smooth transition from summer to fall.
As Henry Wadsworth Longfellow once wrote, "In New England, the seasons are written with a chisel. Winter is stern and rugged, spring reluctant, summer brief but ardent, and autumn magnificent beyond compare."
As always, thank you for your support and readership.
Kyle M. McBurney, CFP®
Managing Partner
CRN202809-9445278
The opinions expressed herein are those of Kyle McBurney, CFP as of the date of writing and are subject to change. This commentary is brought to you courtesy of Highland Peak Wealth which offers securities and investment advisory services through registered representatives of MML Investors Services, LLC (Member FINRA, Member SIPC). Supervisory office: 280 Congress Street, Boston, MA 02210. (617)-439-4389. Highland Peak Wealth is not a subsidiary or affiliate of MML Investors Services, LLC or its affiliated companies. Past performance is not indicative of future performance. Information presented herein is meant for informational purposes only and should not be construed as specific tax, legal, or investment advice. Although the information has been gathered from sources believed to be reliable, it is not guaranteed. Please note that individual situations can vary, therefore, the information should only be relied upon when coordinated with individual professional advice. This material may contain forward looking statements that are subject to certain risks and uncertainties. Actual results, performance, or achievements may differ materially from those expressed or implied. This material does not constitute a recommendation to engage in or refrain from a particular course of action. Referenced indexes, such as the S&P 500, are unmanaged and their performance reflects the reinvestment of dividends and interest. Individuals cannot invest directly in an index.
Glossary of Index Definitions
Indexes are unmanaged, do not incur fees or expenses, do not reflect any deduction for taxes, and cannot be purchased
directly by investors.
The S&P 500® Index is a widely recognized, unmanaged index representative of common stocks of larger capitalized U.S. companies.
The S&P Muni Bond Index is a broad, market value-weighted index that seeks to measure the performance of the U.S. Municipal bond market.
Dow Jones Industrial Average is a price-weighted average of 30 actively traded Blue Chip stocks, primarily industrials, but also including other service-oriented firms; may be used as a benchmark for large cap stocks
NASDAQ Composite is a broad-based index of over 3,000 companies, which measures all domestic, and non-U.S.-based common stocks listed on the NASDAQ Stock Market, Inc.
The NASDAQ 100 U.S. Index is a composed of the 100 largest, most actively traded U.S. companies listed on the Nasdaq stock exchange.
The Russell 2000® Index is a widely recognized, unmanaged index representative of common stocks of smaller capitalized U.S. companies.
The MSCI EAFE Index is a widely recognized, unmanaged index representative of equity securities in developed markets, excluding the U.S. and Canada.
The MSCI Emerging Markets (EM) Index is an unmanaged market capitalization-weighted index of equity securities of
companies domiciled in various countries. The Index is designed to represent the performance of emerging stock markets
throughout the world and excludes certain market segments unavailable to U.S.-based investors.
The MCSI All Country World Index (ACWI) captures large and mid cap representation across 23 Developed Markets and 24 Emerging Markets.
The Barclays U.S. Aggregate Bond Index is a broad measure of the U.S. investment-grade fixed-income securities market.
The Bloomberg U.S. Aggregate Bond Index is an unmanaged index of fixed-rate investment-grade securities with at least one year to maturity, combining the Bloomberg U.S. Treasury Bond Index, the Bloomberg U.S. Government-Related Bond Index, the Bloomberg U.S. Corporate Bond Index, and the Bloomberg U.S. Securitized Bond Index.
The Nikkei Index is a price-weighted index composed of Japan’s top 225 blue-chip companies traded on the Tokyo Stock Exchange.
©2025 Morningstar, Inc. All Rights Reserved. The information contained herein: (1) is proprietary to Morningstar and/or its
content providers; (2) may not be copied or distributed; and (3) is not warranted to be accurate, complete or timely. Neither Morningstar nor its content providers are responsible for any damages or losses arising from any use of this information